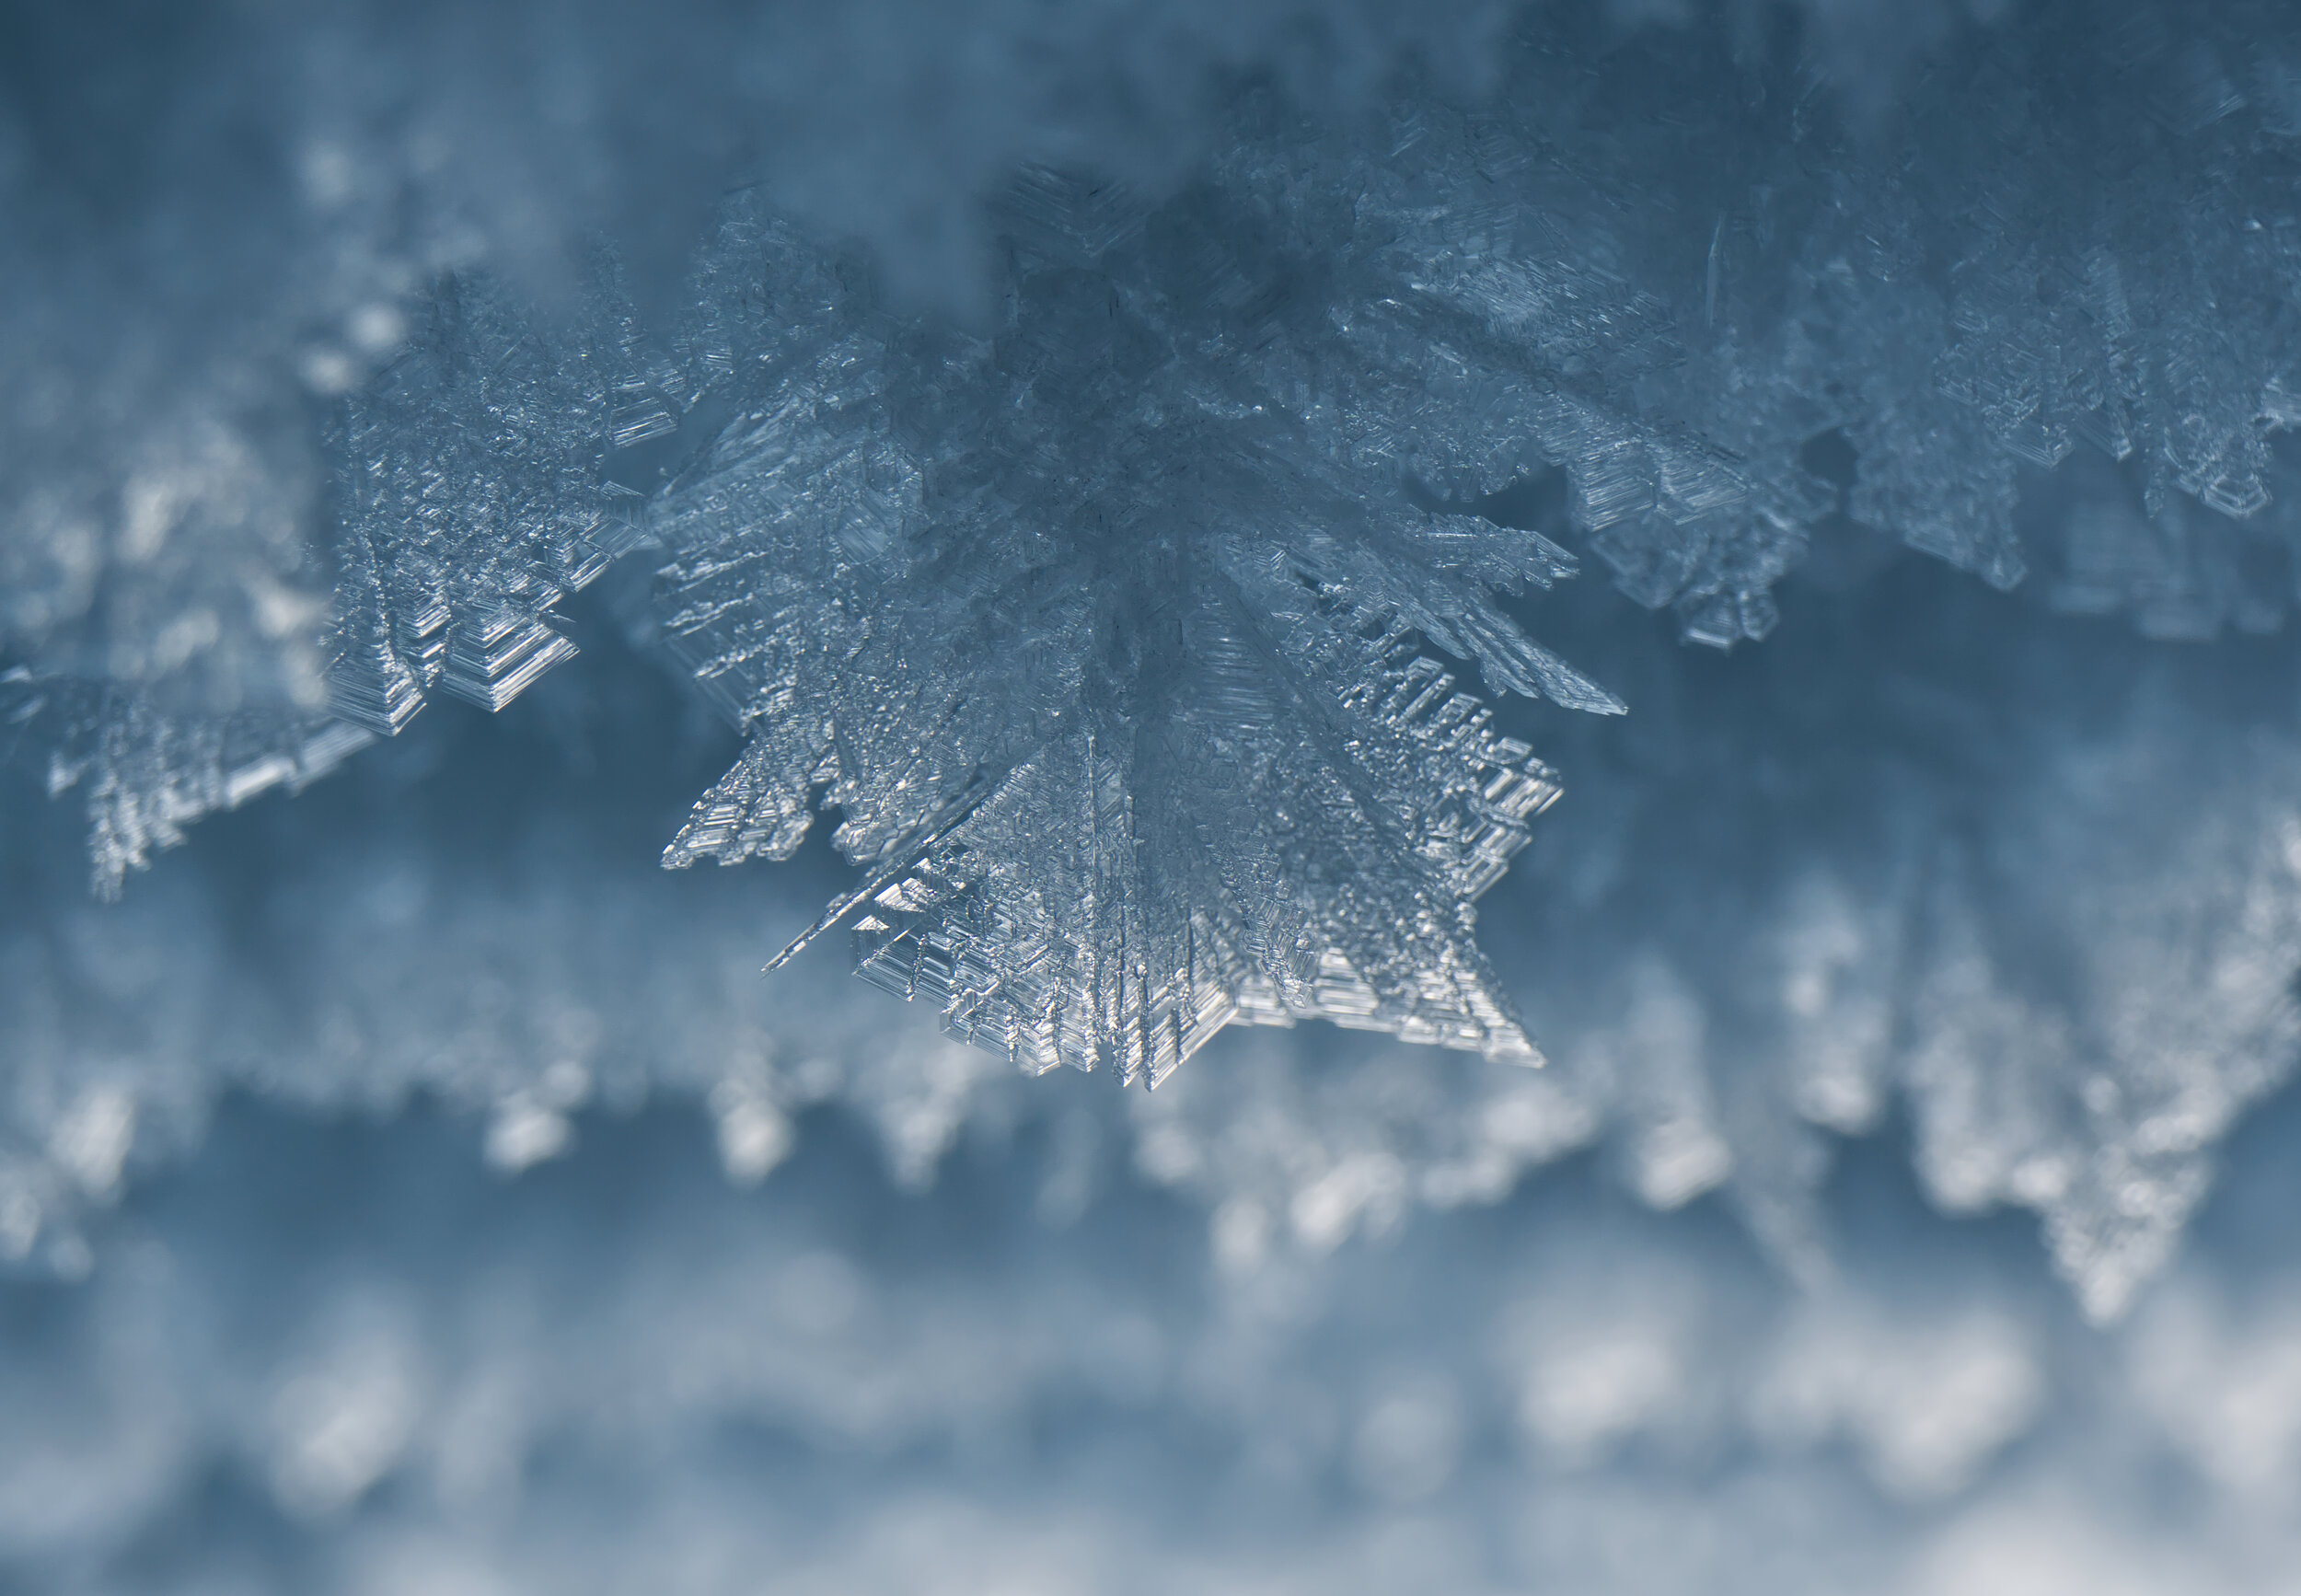
Exploring snow changes with photographs.
Science
Snow2School explores snow changes in the Uummannaq region of Greenland and the Eisenerz region in the Austrian Alps. Climate scientists from the University of Graz and social anthropologists from the University of Vienna are collaborating with students—junior researchers—from both regions! A central aspect of the project is the collection and both quantitative and qualitative analysis of snow photos and their stories. The importance of combining quantitative and qualitative analysis is to be understood in the larger context of global climate change and its impacts in both the Arctic and the Alpine region. This section of the photo exhibition features photos and infographics illustrating the scientific context.
Junior researchers installing scientific equipment, Uummannaq April 2024. The sensor logs temperature and relative humidity every 30 minutes. Temperature and relative humidity are key climate variables when investigating snow cover and snow properties. In the figure below the daily averages of the data is shown from the period mid-April to late June.
Daily averages of the data collected April-June 2024 in Uummannaq.
This figure shows how global (orange), Arctic (purple), and Greenland (green) temperatures have changed relative to the average for 1961-1990. The Arctic is experiencing a more dramatic warming compared to global temperatures (Shahi, 2024). Similarly, the Alps are warming quicker than the surrounding regions – an interesting analogy between Uummannaq and Eisenerz.
May 1, 1998-2008 Eisenerzer Ramsau, Anton Albinger
Anton Albinger, a member of the mountain rescue service and avalanche commission in Eisenerz, took snow measurements in the mountain valley Eisenerzer Ramsau from 1995 to 2008. On May 1st of each year, during the final measurements of the respective winter season, he captured a photo at the mountain inn Gemeindealm. These two photo collages showcase the varying snow conditions over more than 20 years.
May 1, 2000-2007 Eisenerzer Ramsau, Anton Albinger
Time lapse photos of the iconic Uummannaq mountain (“heart shaped”) can be used for analysis of the seasonal snow cover. The camera takes photos of the mountain every 6 hours all year around. In the video, photos from mid-April to early July are shown. We get an idea of the different snowfall events, how quickly the snow melts, and where it stays as isolated snow patches also throughout part of the summer. With AI tools it is possible to calculate the approx. snow fraction of each photo. Combined with a digital elevation model, the snow cover can be quantified. Longer time series and historical photos of the same area make it possible to compare the snow patterns interannually and study trends in the snowfall.


